Anomalous deformation behavior of nanoporous gold
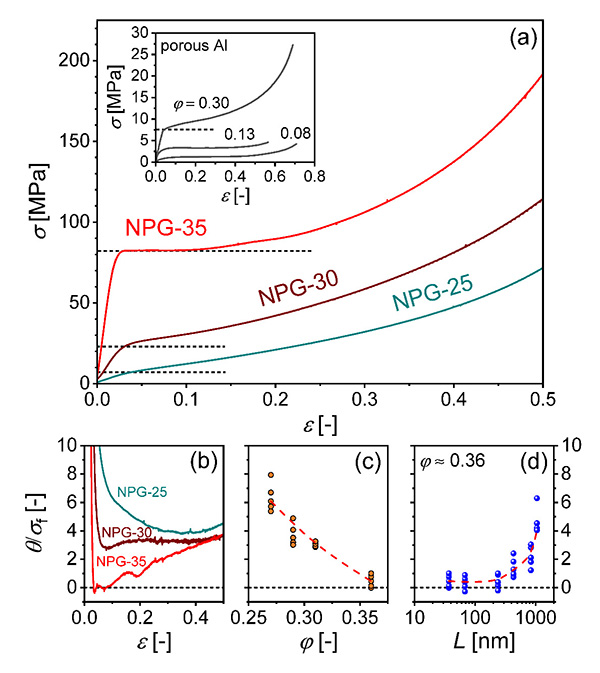
For conventional porous materials under compression, yielding is usually followed by a plateau region of constant stress in their stress–strain curves. This stress plateau, which has been explored for energy-absorbing applications, is associated with the formation and propagation of localized densification bands in porous structure. Inhomogeneous deformation typically occurs in porous materials with relative density (or solid fraction, φ) below 0.30. Above this critical relative density, porous materials usually show uniform deformation and evident strain hardening under compression, similar to their fully-dense counterparts. Because of the "smaller is stronger" effect, nanoporous (NP) metals prepared by dealloying could be more than one-order-of- magnitude stronger than conventional porous materials of same density. However, previous studies showed that NP metals, particularly nanoporous gold (NPG), deformed homogeneously under compression. Their flow stress also increased steadily with increasing strain, showing no stress plateau. According to the notions established in conventional porous materials, the homogeneous deformation and the lack of stress plateau in compression may be attributed to the high relative density of NPGs, which is typically above 0.25.
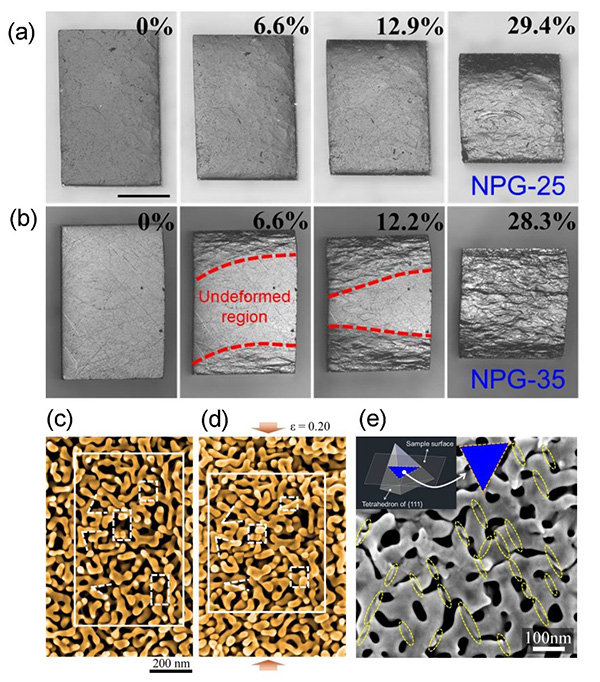
Recently, Scientists from the Shenyang National Laboratory of Materials Science reported that a stress plateau was achieved in the compression of NPGs by further increasing, but not decreasing the relative density (see L.Z. Liu et al, Phys Rev Lett 127, 095501(2021)). This phenomenon is associated with a transition from homogeneous to localized deformation in NPGs as φ increases to above ~1/3, which is inverted compared with that of conventional porous materials. Under compression, the low-density NPGs with φ<1/3 showed evident strain hardening, whereas a stress plateau was observed for high-density NPGs with φ > 1/3, which is contrary to the established notions for conventional porous materials. The ligament pinch-offs and bending-dominated structures are responsible for the homogeneous deformation of low-density NPGs. For high-density NPGs, the compression- or tension-dominated structure enables the collective strain bursts in nano-ligaments, resulting in localized densification and stress plateau in their compression curves. This deformation behavior only occurs in NPGs with ligament diameter smaller than 200 nm. In addition to the nano size effect, the large-scale crystal-lattice coherency arising from the large grain size is also decisive to the mechanical response of dealloyed NPGs.
The transition from homogenous to localized deformation of NPG at around φ~1/3 can be correlated to the deviations of strength and stiffness of NPGs from theoretical values (L.Z.Liu et al, Acta Mater 78(2016)77-87;L.Z. Liu et al, APL 110(2017)211902; H.J. Jin et al, MRS Bull 43(2018)35-42), and the abnormal large sintering rate of NPGs during coarsening (H. Xie et al, Acta Mater 209(2021)116806), which also occur in samples with φ<~1/3. This “magic” relative density (φ~1/3), which decisively control several properties of NPGs, can be linked to topology evolution via surface diffusion in NP structure. The findings in NPGs might then be universal for self-organized nano network materials, whose topology structures are largely shaped by capillarity-driven surface diffusion.
The paper entitled “Transition from Homogeneous to Localized Deformation in Nanoporous Gold” was published in Physical Review Letters. This work was supported by the National Key R&D Program of China and the National Natural Science Foundation of China.

Figure 1. Uniaxial compression behavior of NPG samples. (a) Engineering stress–strain (σ-ε) curves of NPGs at a strain rate of 10-4s-1. The inset figure shows the typical data of conventional porous aluminum. Horizontal dotted lines indicate the level of yield stress for each sample. (b) Variation of normalized strain-hardening rate (θ/σf) with strain for different NPGs. (c) Variation in θ/σf at small strains (ε = 0.07, 0.09, 0.11, 0.13, and 0.15) with relative density. (d) Variation in θ/σf (at small strains) with ligament size for NPG-35.

Figure 2. Deformation of NPG under compression. Consecutive optical images of (a) NPG-25 and (b) NPG-35 samples compressed to different strains. The scale bar is 0.5 mm. (c-d): SEM observation of the same area on the surface of NPG-25 (c) before and (d) after compression (ε = 0.20). (e) High-magnification SEM image of an area in the deformation band of a compressed NPG-35 (ε = 0.10), where the slip traces are indicated by dotted ellipses. Inset: Intersection lines of {111} planes with the sample surface in this area.